No matter what role you’re in, it’s crucial to have data and analytics that help you hit your Key Performance Indicators (KPIs). The old adage, you can’t manage what you don’t measure, remains true no matter how many new tools and technology platforms hit the market. It is especially true for improving your recruiting process.
It is one of the busiest job markets in history. Hopefully, you and your team have recruitment tech that provides a robust set of analytics and reporting so you can make clear decisions and track your progress towards hitting your KPIs.
Of course, the most important job right now is getting your job requirements filled. However, tracking your progress and your team’s performance during such a fast-paced time will serve your organization and recruitment process well into the future.
Is your cost per hire breaking the bank? Do you even know what yours is? Check out how to find it, and other KPIs you should be maximizing in this article from @TheTalentWall™ Share on XThere are countless articles discussing how recruiters and talent acquisition professionals need to track success. However, the truth is that every organization has different processes and needs when it comes to reporting.
That said, we’ve gathered some of the most important recruitment KPI you should be tracking with your recruitment tech.
Recruitment KPI #1 – Cost Per Hire
Hiring is increasingly expensive. The costs have continued to rise every month during the past year. Many organizations are struggling to offer more compensation dollars for their A+ candidates.
All that extra cash rarely trickles down to the candidates coming through the proverbial front door. Instead, hiring budgets go primarily to technology, platforms, people, and advertising.
According to a benchmark report from 2021, the average cost per hire is $4,425, although that figure can vary widely depending on:
- the type of hire
- how competitive the talent marketplace is
- how difficult the job is to recruit for
- a company’s brand and reputation.
Tracking your cost per hire will help you determine how much you’re spending on recruitment and whether specific investments (like job boards, social promotions, outsourced recruitment teams, etc.) are worth the investment.
One way to track your cost-per-hire easily is by setting up an automated report that pulls in data from your recruitment tech about the number of hires, the cost per hire, and the source of those hires.
Benchmarking cost-per-hire — the recruitment metric used to measure recruitment spend against recruitment goals — is among the most important recruitment metrics to monitor in your recruitment department. For example, if this year’s recruitment goal is to save 10% on recruitment costs, you should track that metric as part of your recruitment KPIs.
Recruitment leadership cares about these metrics because they are constantly running a cost-benefit analysis to ensure each investment is worth it in the long run. Your KPI reporting ensures budgeting isn’t affected.
When calculating cost-per-hire metrics, ask yourself these questions:
- What is the impact on our business if we don’t have this role filled?
- How will particular departments be affected if the candidate isn’t hired by a specific date?
- If this is a critical role, how long has it been open?
- Are we losing revenue because this role has been unfulfilled?
If you can answer these questions and prove your investment’s value to the overall business, then your department will be crucial in growing the organization.
Read On: Onboard New Recruiters Right
Now Dive Deeper With Volume of Applicants and Leads
The strength of your recruiting team depends on how many recruitment leads it generates. If you attract high-quality recruitment leads, more time is available for your recruitment team to source and attract passive candidates (candidates who do not intend to change jobs but may be enticed to apply for your recruitment role).
It’s important to analyze which recruitment sources are yielding the highest number of great candidates for your recruitment hub, as recruiting teams are constantly seeking to increase the number of quality applicants.
According to this study by LinkedIn Talent Connect, recruitment professionals are finding the best results from referrals (24%), career sites (20%), recruitment advertisements (19%), and recruitment agency partners (11%).
Look at your recruitment metrics and ask: are we getting enough candidates from our recruitment sources? Where can you find the best candidates at the lowest cost? How can our recruiting strategies be improved? What recruitment advertisements should we run?
You will be able to determine where to focus your recruitment efforts and how far each recruiting source needs to grow if you can answer these questions. Furthermore, if your team can show high numbers of quality candidates coming from cost-effective sources, your team will be able to increase the budget to grow recruiting sources and improve recruitment results.
Recruitment KPI #2 – Time to Fill
In general, TTF isn’t a new metric. But, there seems to be some confusion between this and other similar metrics. Time to Fill is the amount of time that elapses between the position opening and the accepted offer.
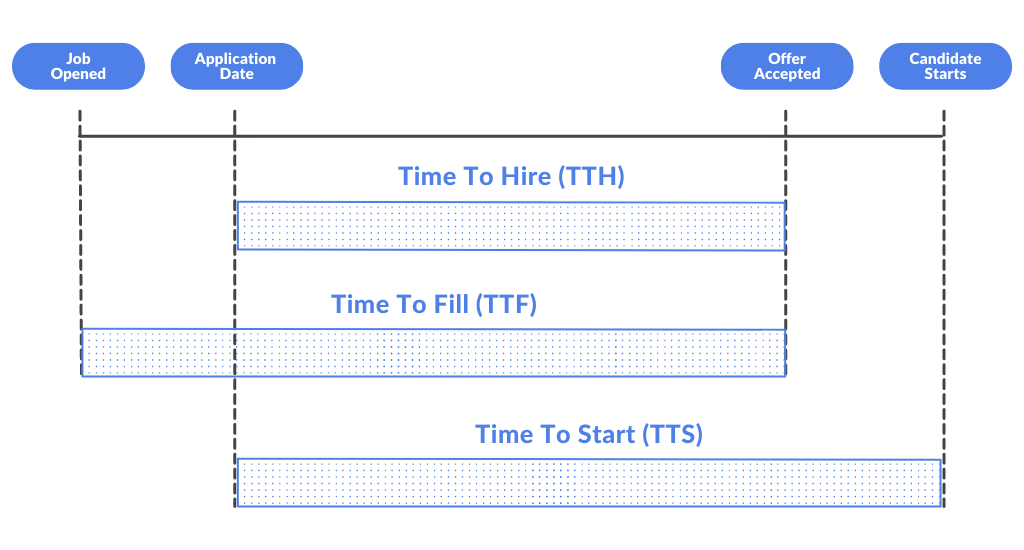
It’s essential for the recruiting or hiring team to consistently measure the complete hiring process looking for areas to improve to shorten the time it takes to fill open positions. The report mentioned above says it takes 36 to 42 days to fill an average position in the United States. In this hot candidate market, moving slowly on people in your process means losing them to the competition.

If you’re looking for additional financial context, consider taking a different approach, and instead of focusing on time to fill, try cost per vacancy. When you calculate the cost per vacancy, you get a quantifiable daily cost for each day the role remains open. This approach can unlock more budget when viewed as costing the organization by remaining open versus the cost per hire.
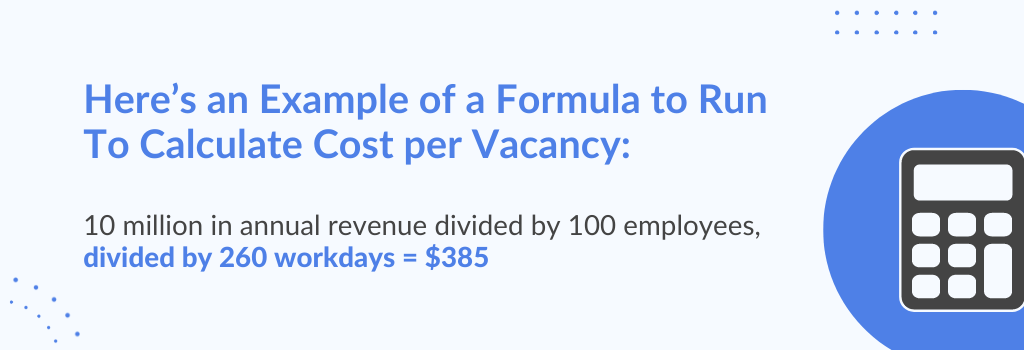
Here’s an example of a formula to run to calculate cost per vacancy:
10 million in annual revenue divided by 100 employees
Divided by 260 workdays = $385
Now, for any role, you need to estimate how important it is to the company’s revenue. Break them into three different categories: necessary, essential, and critical roles. For each, let’s use 0.1 for necessary, 0.5 for essential, and 1 for a critical role. Using our calculations from above, for a necessary role the cost per vacancy is about $39, for an essential role, it’s $192, and for a critical role, it’s $385.
When presenting these metrics, be sure to have real data to back up your calculations. If your recruitment analytics dashboard is set up correctly, it should be very easy to come up with these numbers.
Now Dive Deeper With: Individual vs Organizational Time to Hire
It is vital to keep in mind that recruitment metrics often differ from the KPIs of the department as a whole, and recruitment metrics should be tracked at both individual and organizational levels.
KPIs for Individual Recruitment: For each role in a recruitment process, you’ll need to measure the time-to-fill (TTF). The recruitment KPIs may vary by role and recruitment goal. If you need to hire more quickly, the TTF could be one of the most important recruitment metrics for you. On the other hand, if you need to reduce the time-to-hire (TTH), the TTF might not matter as much.
KPIs for Organizational Recruitment: KPIs for organizational recruitment may be oriented around the overall recruitment funnel and where bottlenecks are occurring. Your organization’s recruitment velocity (the speed at which the candidate is hired from start to finish), cost per hire, total time-to-hire, and recruitment manager productivity are some of the most important recruitment KPIs.
What’s your offer acceptance rate? @TheTalentWall™ breaks down how to measure it- then how to beat it. Share on XYou’ll also want to understand these metrics by department and location so you can better understand trends and remove bottlenecks. It’s likely that your TTH for a Customer Support person will be less than for your VP Eng, so you’ll want to consider those metrics separately.
Recruitment KPI #3 – Offer Acceptance Rates
You’ve Heard Of: Offer Acceptance Rates
Another important metric you should be tracking in your recruitment analytics dashboard is offer acceptance rates. If your dashboard isn’t pulling this information for you or you don’t have a tool that will allow you to pull this information easily, you can still calculate it. Look at how many offers your company has extended and what percentage of those are accepted.
Tip: It’s best to calculate these metrics quarterly instead of monthly.
If you see metrics decrease, it’s time to start looking at the reasons candidates are rejecting offers and begin auditing what you could improve upon with the next one. Look at the job description. Did you list out all of the tasks and duties associated with the role?
Tip: Instead of listing out the daily, weekly, and monthly tasks, consider describing what it’s like to work in this role and its overall impact on the company. This gives candidates a look inside the company, providing them a bit more color instead of just a list of tasks they will be working on.
Now Dive Deeper With: % of applicants who make it through the recruitment process to an offer and % of recruitment offers that are accepted
In addition to standardizing processes, recruitment software can also provide data points on whether you are hiring people who meet your recruitment criteria (as opposed to just hiring candidates based on their application).
Recruitment software can also provide you with recruitment data such as how many candidates didn’t accept your recruitment offer and whether or not any changes need to be made to recruitment communication tactics, such as the interview time and place. When you’re having trouble attracting the recruitment employees you want, recruitment software can also tell you what your competitors are doing to attract candidates.
Speaking of communication: 6 Reasons Your Team Needs An Internal Communication Plan
Recruitment KPI #4 – Recruitment Velocity
You’ve Heard Of: Recruitment velocity
From start to finish, recruitment velocity refers to how quickly you fill a role (from first outreach to offer acceptance). When a recruitment organization can fill recruitment positions quickly, it can meet its goals more effectively, as well as recruit top talent much more easily.
Quick Tip: Keep Tabs on the One That Got Away
Now Dive Deeper With: Total recruitment time-to-hire
Recruitment velocity minus cost per hire is the recruitment KPI that measures timelines between first outreach and offer acceptance. This recruitment metric will help you identify where your recruitment efforts are being wasted or inefficient, as a longer time-to-hire typically results in a higher total recruitment cost.
By monitoring these recruitment KPIs (and adding some new ones to your arsenal), you will know exactly where to proceed in the hiring process. The right recruitment software platform will help you monitor your recruitment practices and ensure you’re presenting the right job offers to the right people. By using data-driven hiring decisions, your business will improve its operations.
Book a demo today to see how TalentWall™ can help you track these metrics, collaborate more effectively and increase recruitment performance by harnessing the power of your ATS.